Information on applications for initial training in England
1. Number of total applications
In 2021, 17% of applicants succeeded in gaining a place on the Educational Psychology Funded Training (EPFT) scheme.
| Year | Total Applicants | Total Places | Success Rate |
| 2021 | 1169 | 203 | 17% |
| 2020 | 1132 | 203 | 18% |
| 2019 | 1138 | 160 | 14% |
| 2018 | 1105 | 160 | 14% |
| 2017 | 1055 | 150 | 14% |
| 2016 | 1001 | 150 | 15% |

2. Applications to each training course
2021
| Total Number of applications | Successful Applications | Success Rate | |
| Institute of Education | 343 | 16 | 5% |
| Newcastle University | 116 | 12 | 10% |
| Tavistock and Portman NHS Foundation Trust | 260 | 16 | 6% |
| Universities of Exeter | 109 | 10 | 9% |
| University College, London | 384 | 16 | 4% |
| University of Birmingham | 272 | 18 | 7% |
| University of Bristol | 197 | 10 | 5% |
| University of East Anglia | 101 | 15 | 15% |
| University of East London | 302 | 16 | 5% |
| University of Manchester | 339 | 24 | 7% |
| University of Nottingham | 311 | 16 | 5% |
| University of Sheffield | 328 | 18 | 5% |
| University of Southampton | 150 | 16 | 11% |
2020
| Total Number of applications | Successful Applications | Success Rate | |
| Institute of Education | 318 | 16 | 5% |
| Newcastle University | 136 | 12 | 9% |
| Tavistock and Portman NHS Foundation Trust | 236 | 16 | 7% |
| Universities of Exeter | 96 | 10 | 10% |
| University College, London | 323 | 16 | 5% |
| University of Birmingham | 304 | 18 | 6% |
| University of Bristol | 170 | 10 | 6% |
| University of East Anglia | 86 | 15 | 17% |
| University of East London | 283 | 16 | 6% |
| University of Manchester | 379 | 24 | 6% |
| University of Nottingham | 280 | 16 | 6% |
| University of Sheffield | 318 | 18 | 6% |
| University of Southampton | 126 | 16 | 13% |
2019
| Total Number of applications | Successful Applications | Success Rate | |
| Institute of Education | 339 | 14 | 4% |
| Newcastle University | 135 | 10 | 7% |
| Tavistock and Portman NHS Foundation Trust | 234 | 14 | 6% |
| University College, London | 355 | 14 | 4% |
| University of Birmingham | 255 | 13 | 5% |
| University of Bristol | 203 | 10 | 5% |
| University of East Anglia | 82 | 10 | 12% |
| University of East London | 304 | 14 | 5% |
| University of Exeter | 115 | 10 | 9% |
| University of Manchester | 327 | 13 | 4% |
| University of Nottingham | 265 | 12 | 5% |
| University of Sheffield | 287 | 12 | 4% |
| University of Southampton | 144 | 14 | 10% |
2018
| Total Number of applications | Successful Applications | Success Rate | |
| Institute of Education | 337 | 14 | 4% |
| Newcastle University | 114 | 10 | 9% |
| Tavistock and Portman NHS Foundation Trust | 260 | 14 | 5% |
| University College, London | 344 | 14 | 4% |
| University of Birmingham | 263 | 13 | 5% |
| University of Bristol | 213 | 10 | 5% |
| University of East Anglia | 63 | 10 | 16% |
| University of East London | 286 | 14 | 5% |
| University of Exeter | 119 | 10 | 8% |
| University of Manchester | 289 | 13 | 4% |
| University of Nottingham | 241 | 12 | 5% |
| University of Sheffield | 261 | 12 | 5% |
| University of Southampton | 171 | 14 | 8% |
2017
| Total Number of applications | Successful Applications | Success Rate | |
| Institute of Education | 321 | 14 | 4% |
| Newcastle University | 115 | 10 | 9% |
| Tavistock and Portman NHS Foundation Trust | 255 | 14 | 5% |
| University College, London | 348 | 14 | 4% |
| University of Birmingham | 286 | 13 | 5% |
| University of Bristol | 217 | 10 | 5% |
| University of East London | 278 | 14 | 5% |
| University of Exeter | 129 | 10 | 8% |
| University of Manchester | 288 | 13 | 5% |
| University of Nottingham | 241 | 12 | 5% |
| University of Sheffield | 255 | 12 | 5% |
| University of Southampton | 146 | 14 | 10% |
2016
| Total Number of applications | Successful Applications | Success Rate | |
| Institute of Education | 344 | 14 | 4% |
| Newcastle University | 104 | 10 | 10% |
| Tavistock and Portman NHS Foundation Trust | 228 | 14 | 6% |
| University College, London | 348 | 14 | 4% |
| University of Birmingham | 236 | 13 | 6% |
| University of Bristol | 156 | 10 | 6% |
| University of East London | 272 | 14 | 5% |
| University of Exeter | 103 | 10 | 10% |
| University of Manchester | 283 | 13 | 5% |
| University of Nottingham | 220 | 12 | 5% |
| University of Sheffield | 246 | 12 | 5% |
| University of Southampton | 140 | 14 | 10% |
3. Analysis of Applications - Equality and Diversity (2016 - 2020)
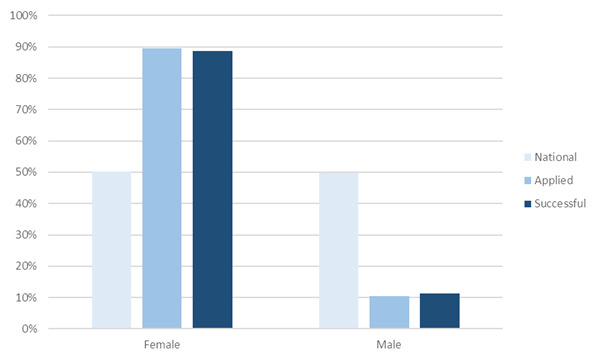
Gender
Although there is a roughly 50/50 split between males and females in England, about 90% of applications for EP training were from females. There was no significant gender difference between those who applied and those who were successful.
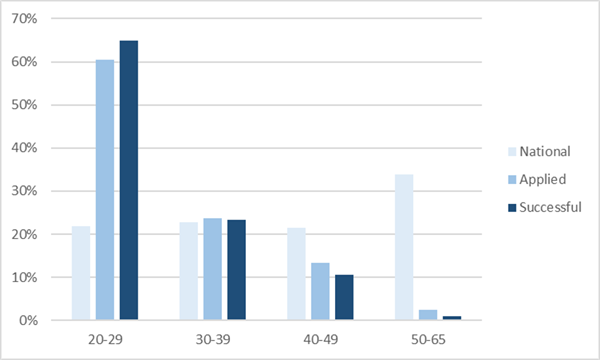
Age
As expected, there was a significant difference between the national population age distribution and the population that applied for EP training, with more applicants coming from the younger age group categories. Within the applicant pool, a good number of applicants from all age groups were successful, though there was a slight tendency for younger applicants to be more successful.
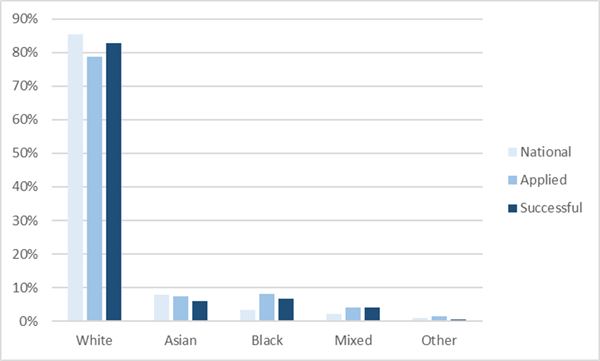
Ethnicity
Compared to the national distribution, White and Asian ethnicities were slightly under-represented, and Black and Mixed ethnicities were slightly over-represented, within the applicant pool. There was no significant ethnicities difference between those who apply and those who are successful.
Disability
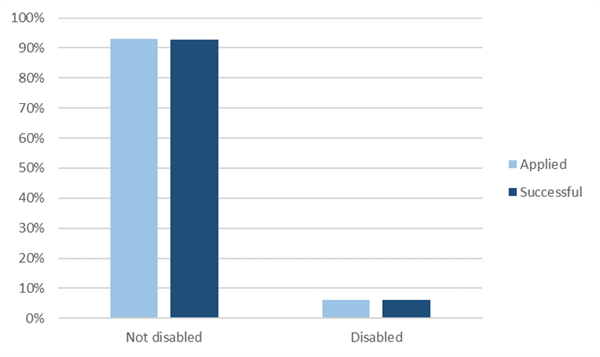
Applicants who declared a disability were as likely as those who did not declare a disability, to be successful in their application.
Sexual Orientation
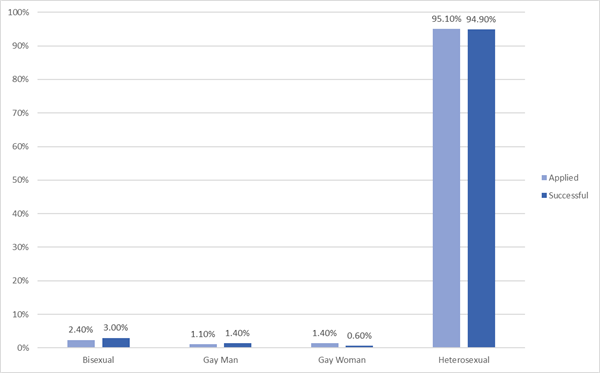
Applicants declaring different sexual orientations were equally likely to be successful in their applications.
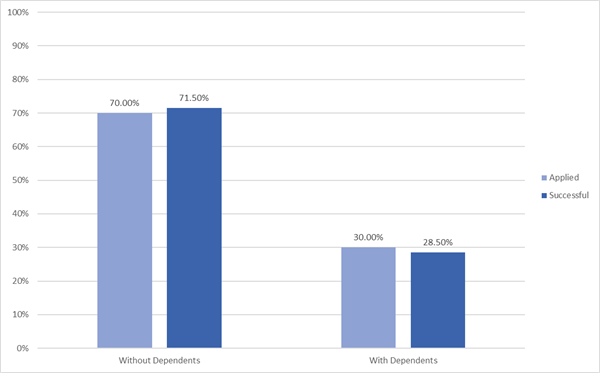
Dependents
Applicants declaring themselves to have dependents were as likely to be successful in their applications as those who declared themselves not to have dependents.
